FFT Analysis
The FFT Analysis window displays data from either Capture, TyphoonSim Scope, or Signal Analyzer transformed by Fast Fourier Transformation.
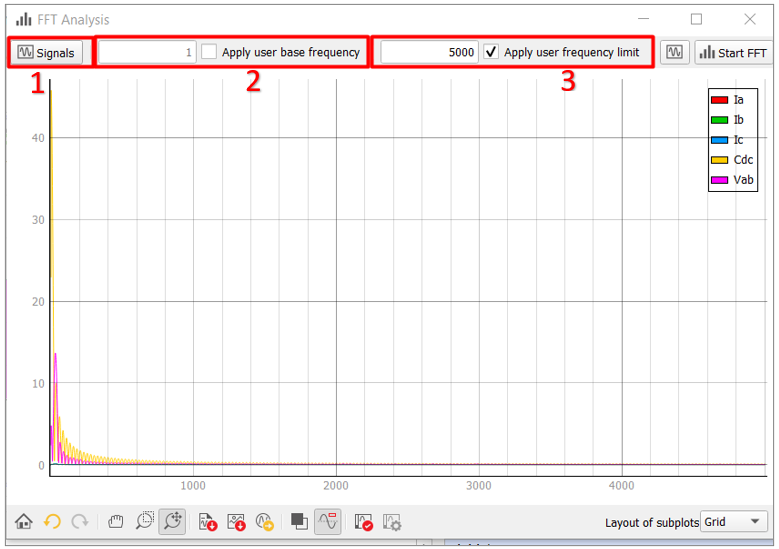
The FFT Analysis window consists of the following elements:
- The Signals button - opens the Signals Window
- Base frequency settings (an input field and a checkbox) - checking the Apply user base frequency will apply FFT with the base frequency set by the user in the input field to the left of the checkbox. Base frequency represents the fundamental harmonic with which Fast Fourier Transformation is applied. If it is not specified or if unchecked, the base frequency is calculated based on the length of the observed interval of the signals: if that length is, for example, 2 seconds, then the base frequency is 0.5 Hz (1 / 2 seconds).
- Frequency limit settings (an input field and a checkbox) - checking the Apply user frequency limit will apply FFT with the frequency limit set by the user in the input field to the left of the checkbox.
- Standard plot interaction toolbar - contains standard undo/redo buttons, pan/zoom commands, export signals to a file, export plot as a .PNG image, visual settings for the background and the legend, as well as the Signal Properties and the layout of the subplots.
The FFT Analysis window displays transformed data from Capture, TyphoonSim Scope, or Signal Analyzer. If the data source is Capture or TyphoonSim Scope, the FFT Analysis window will apply FFT and display the newly transformed data each time data is captured.
Note: If cursors on Capture, TyphoonSim Scope, or Signal Analyzer are moved, added, or removed, this
will trigger application of FFT on the data currently displayed in them (moving and
adding will reapply when there are 2 cursors).