Overview page
One of the main features of Typhoon Test Hub is improved visibility of both test results and system performance. You can have an overall performance view at a glance or dive into details. Executions carry important information about how a test was executed and what was used, so you can reproduce tests and have traceability.
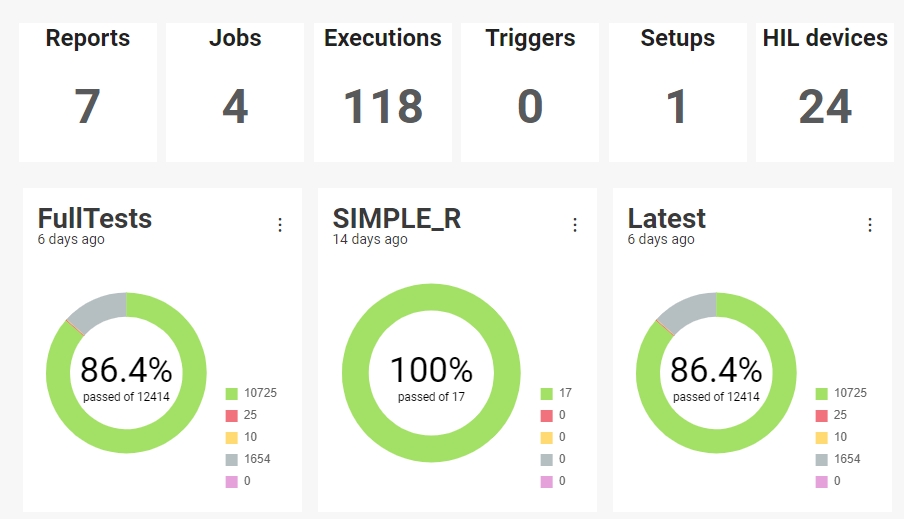
The overview page is setup for a quick overview of the whole system. Most of the items on this page are linked and will direct you to another page where more details about the item can be located. At the very top (Figure 1), you can see the latest results for a group of tests (3 donut graphs) and how long ago they were updated, together with a trend view (as a line or bar graph) of the test results. You can easily select a different group of tests from among those displayed in each graph.

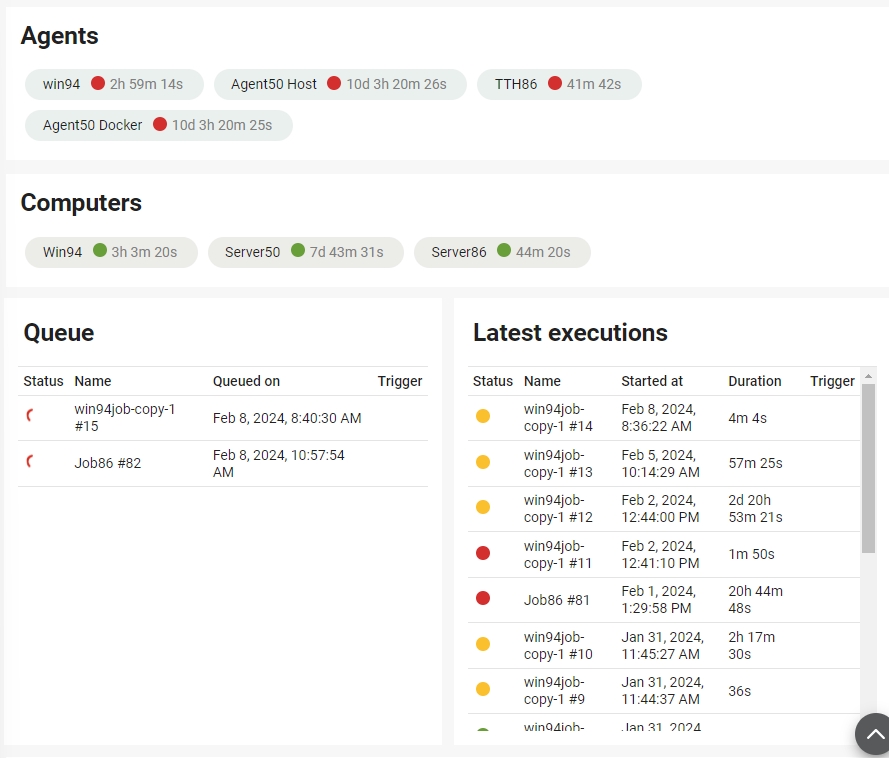
Further down (Figure 2), there is a list of all Agents, informing which are currently running, online, or offline. Similarly, there is a list of all the Computers currently connected to the Hub, their status, and for how long they are in that state. The Queue table shows executions which are currently running or queued to run. The Latest Executions table shows executions that have already completed.

As mentioned before, this is an interactive Overview. Clicking on items on the Overview page will take you to a corresponding screen where more details can be found. For example, if you click on a graph, it will take you to a report page specific to that result. From the report page (Figure 3), you can see a list of all reports in addition to more details per each selected report.

System events and configuration changes are stored so you can trace back activities and actions in your system. You can also visualize your system utilization in the time trace (Figure 4), which shows if HILs, Agents, and Setups are offline, available, or running.


Changing the options
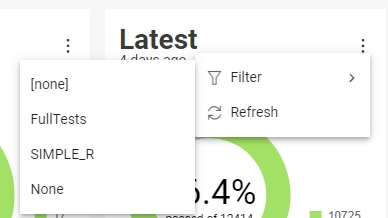
Clicking on three dots will show a menu (Figure 5) where you can select from a report and tag which data will be shown in the graph.
